 |
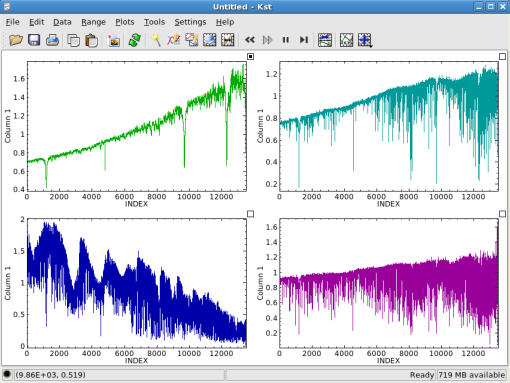
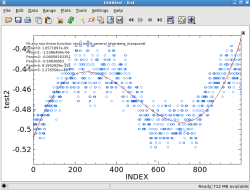
Kst truly excels at plotting large amounts of live data, of the sort commonly produced by scientific missions, automatically updating when new data is available. Kst is equally at home with static data. Numerous data formats are already supported and additional formats can be easily added via a plugin mechanism.
As one might expect, Kst handles zooming and scrolling through data with ease, together with the ability to mark areas of interest for further investigation. Event notification is also supported; allowing the user to define a set of anomalous conditions, which when triggered can be reported through email, ELOG, or the running of a script.
 |  |
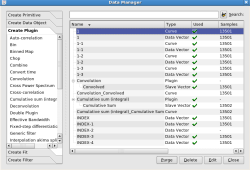 |  |
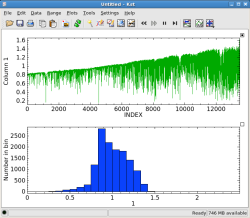
To allow for the rapid inspection and qualification of data, Kst can also quickly create user-defined equations, histograms, power spectra, and numerous other transformations. Data sets can also be fit with a wide range of functions, or filtered (high-pass, low-pass, band-pass, etc). The creation of new methods to manipulate data sets is easily achieved through a simple plugin mechanism.
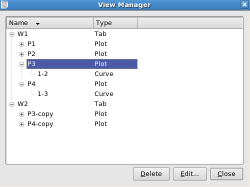
The interface to Kst is designed to be as intuitive as possible and complete documentation is available. Kst also supports a command-line interface and is fully scriptable, for those who want to automate Kst.
Kst 1.x is now relatively mature and further changes are driven primarily by the needs of the Planck team; though feature requests and/or bug reports are always welcome from anyone. Recent development has focused on extending and enhancing the scripting capabilities, so that complex scripts can be created to drive Kst. Development in the immediate future will be driven by the imminent launch of the Planck satellite.
At the same time work on the next generation of Kst (version 2.0, based on Qt4), primarily by Mike Fenton, continues and its release is expected soon. This will benefit from some of the architectural lessons learned from 1.x and also support running under Windows.
 KDE Commit-Digest
